 SuppRanked
The State of Supplements on Amazon: October 2026
What 935 supplement brands and 3,202 best-selling products tell us about Amazon's biggest health aisle: who leads, how concentrated each category is, who owns the leaders, and what shoppers put in the cart.
Key findings
- A ~$6B-a-year market, by our model. The 935 supplement brands we track sold an estimated ~$513M a month on Amazon.com (about $6.16B a year at that run rate), across 3,202 best-selling products in 40 categories.
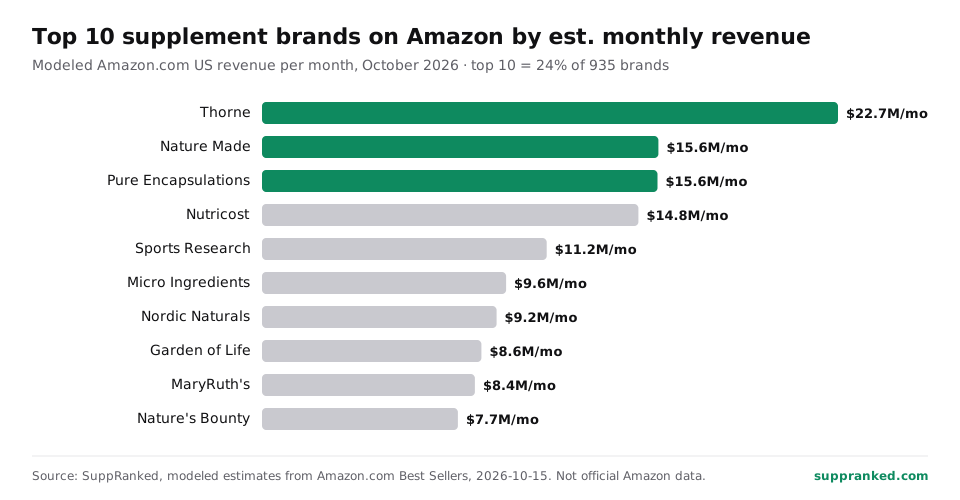
- Thorne leads the market on our model. The top three by est. monthly revenue are Thorne (~$22.7M), Nature Made (~$15.6M), Pure Encapsulations (~$15.6M). Thorne gets there with 52 ranked products, against 96 for Nature Made and 83 for Nutricost. See the full profile.
- A long tail: 885 brands share about half the market. The top 10 brands take 24% of est. revenue and the top 50 take 51%. The other 885 brands split the rest; the median brand sells about $134K a month on our model, and 112 brands clear an est. $1M a month.
- Concentration varies 3x by category. In Vitamin C the top three brands hold 47% of est. revenue; in Collagen they hold just 15%. The median category sits at 30%, so most supplement aisles on Amazon are still open to challengers.
- Big consumer groups own about half of the top 50, and the line is moving. Brands owned by large consumer-goods, pharma, food or retail groups account for 44% of the top 50's est. revenue (22 of 50 brands). Once P&G's announced deal for Thorne closes, that rises to 52%.
- Creatine gummies are a real business now. Gummies make up 21% of est. creatine revenue (21 of the top 100 creatine listings). The typical creatine powder tub sold is 100 servings at about $0.28 a serving.
- Glycinate is the magnesium shoppers buy; isolate leads whey. Products naming magnesium glycinate take 75% of est. magnesium revenue (65 of 100 listings), most often in a 90-count bottle. In whey protein, isolates take 53% of est. revenue, the typical tub is 2 lb, and clear whey already has 9%.
- The $25 bottle, and the fastest-moving aisles. The median list price of a best-selling supplement is $24.99 (2,844 priced products). By est. units per listed product, the fastest-moving lists are Magnesium, Creatine, Vitamin B.
The top 10 brands by est. revenue
| # | Brand | Est. revenue/mo | Ranked products |
|---|---|---|---|
| 1 | Thorne | ~$22.7M | 52 |
| 2 | Nature Made | ~$15.6M | 96 |
| 3 | Pure Encapsulations | ~$15.6M | 36 |
| 4 | Nutricost | ~$14.8M | 83 |
| 5 | Sports Research | ~$11.2M | 37 |
| 6 | Micro Ingredients | ~$9.6M | 40 |
| 7 | Nordic Naturals | ~$9.2M | 37 |
| 8 | Garden of Life | ~$8.6M | 44 |
| 9 | MaryRuth's | ~$8.4M | 42 |
| 10 | Nature's Bounty | ~$7.7M | 63 |
The full ranking of all 935 brands is on the live leaderboard, which updates daily. This report is a frozen snapshot, so the numbers above will not change.
How concentrated is each category?
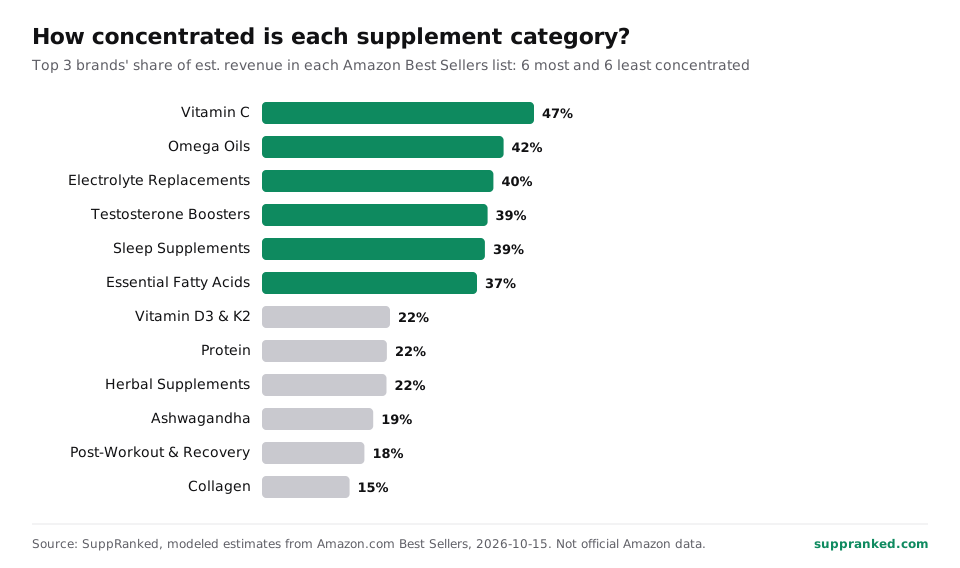
We measure concentration as the share of a list's est. revenue that goes to its three biggest brands, across 37 mid-level and leaf Best Sellers lists. A low share means a crowded field with room for new brands; a high share means a few names carry the list. Every category has its own page, for example Vitamin C and Collagen.
Fastest-moving categories
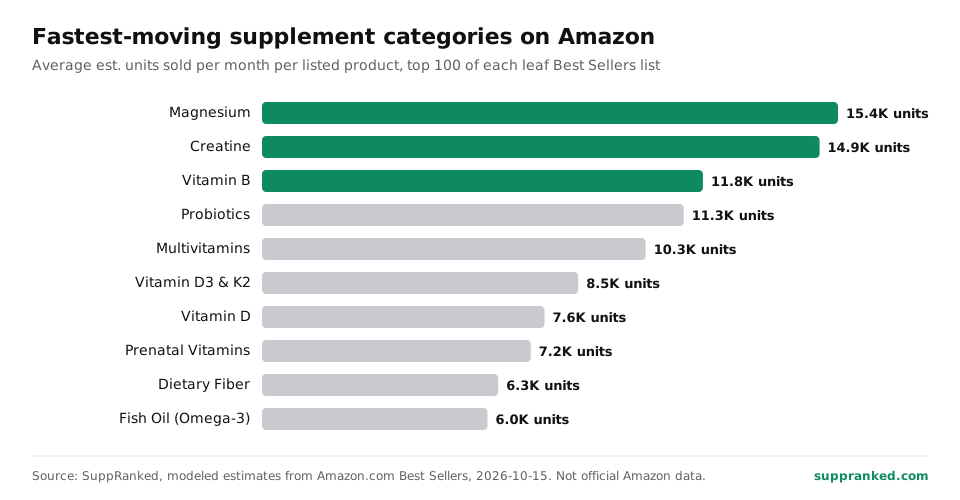
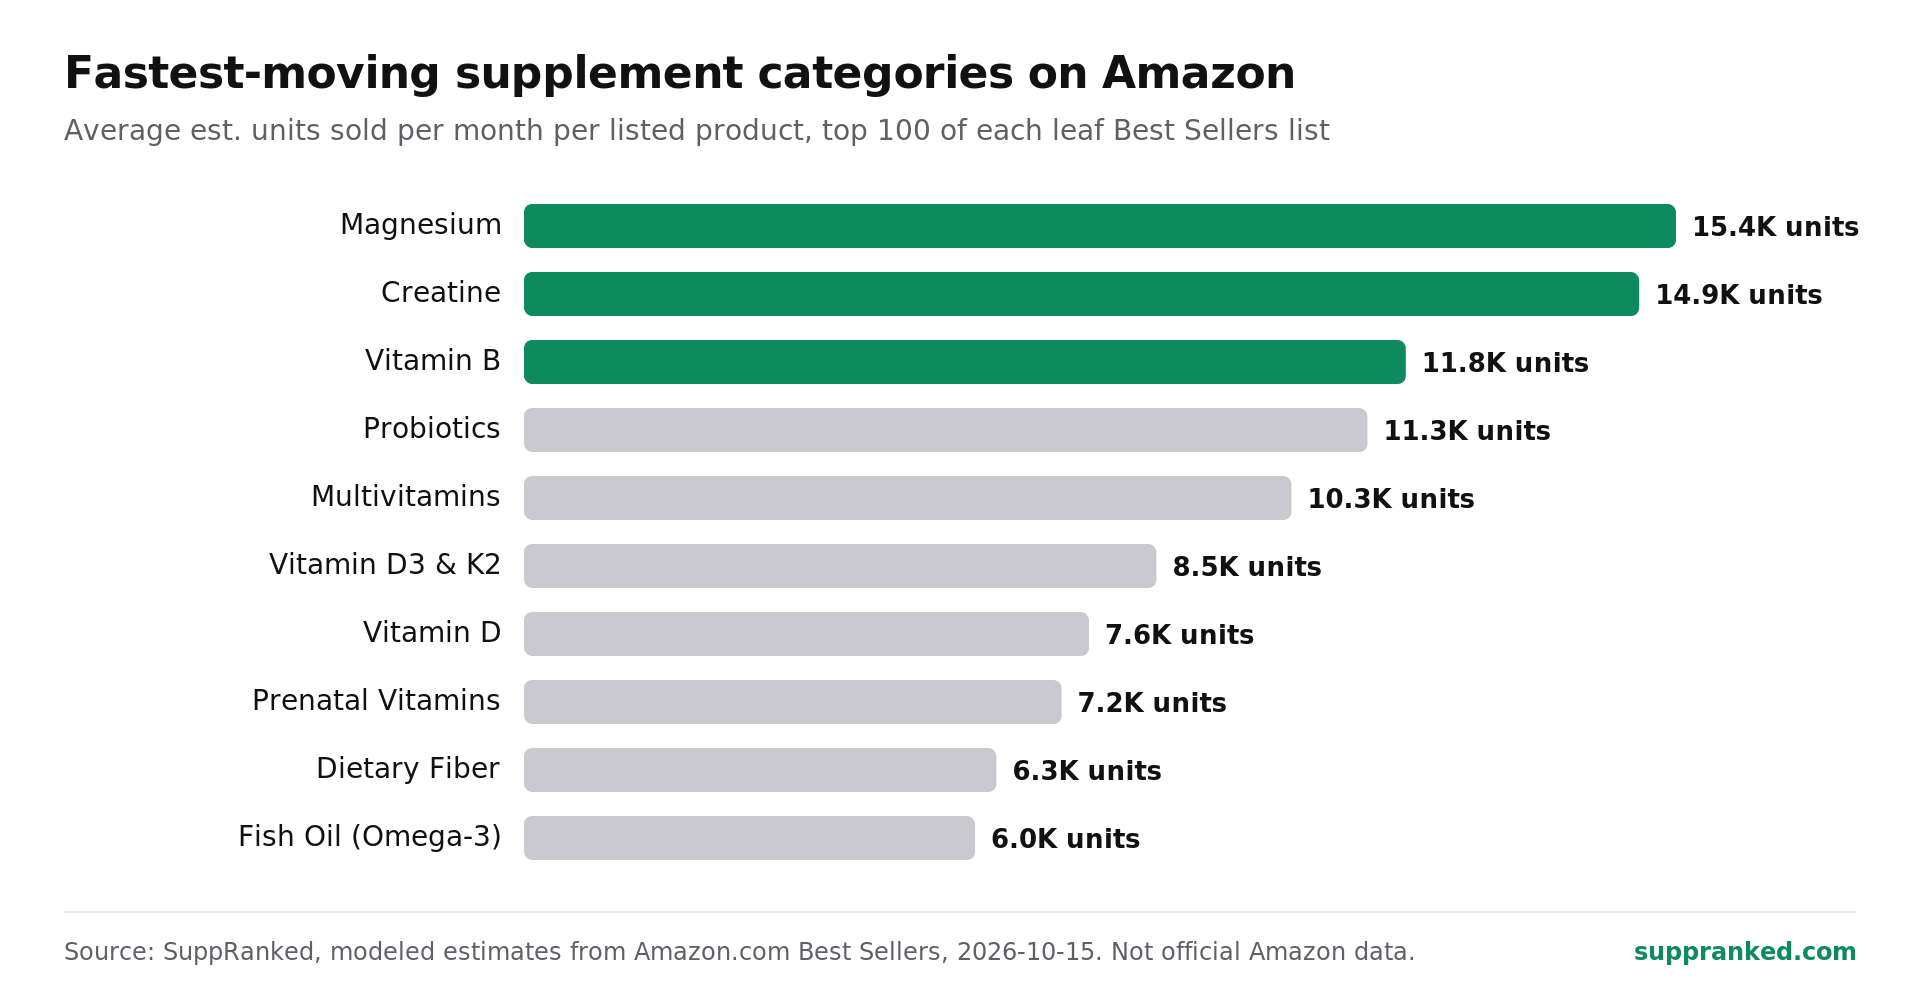
This is a velocity measure from one snapshot, not growth over time: it shows how many units the average best-selling product in each list moves. Growth trends will appear on Fastest growing as daily snapshots build up.
Who owns the leaders?
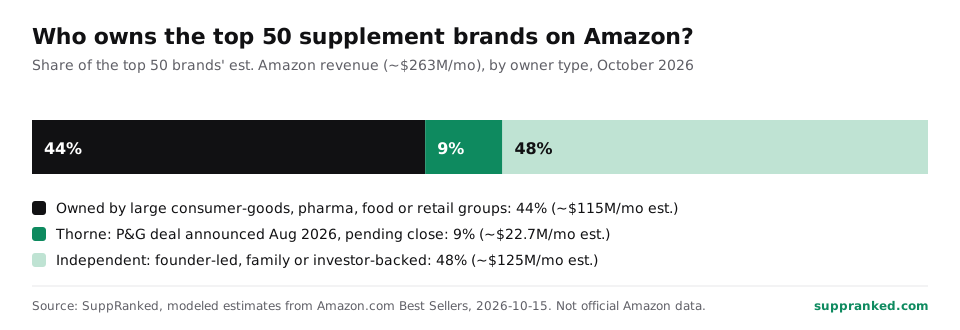
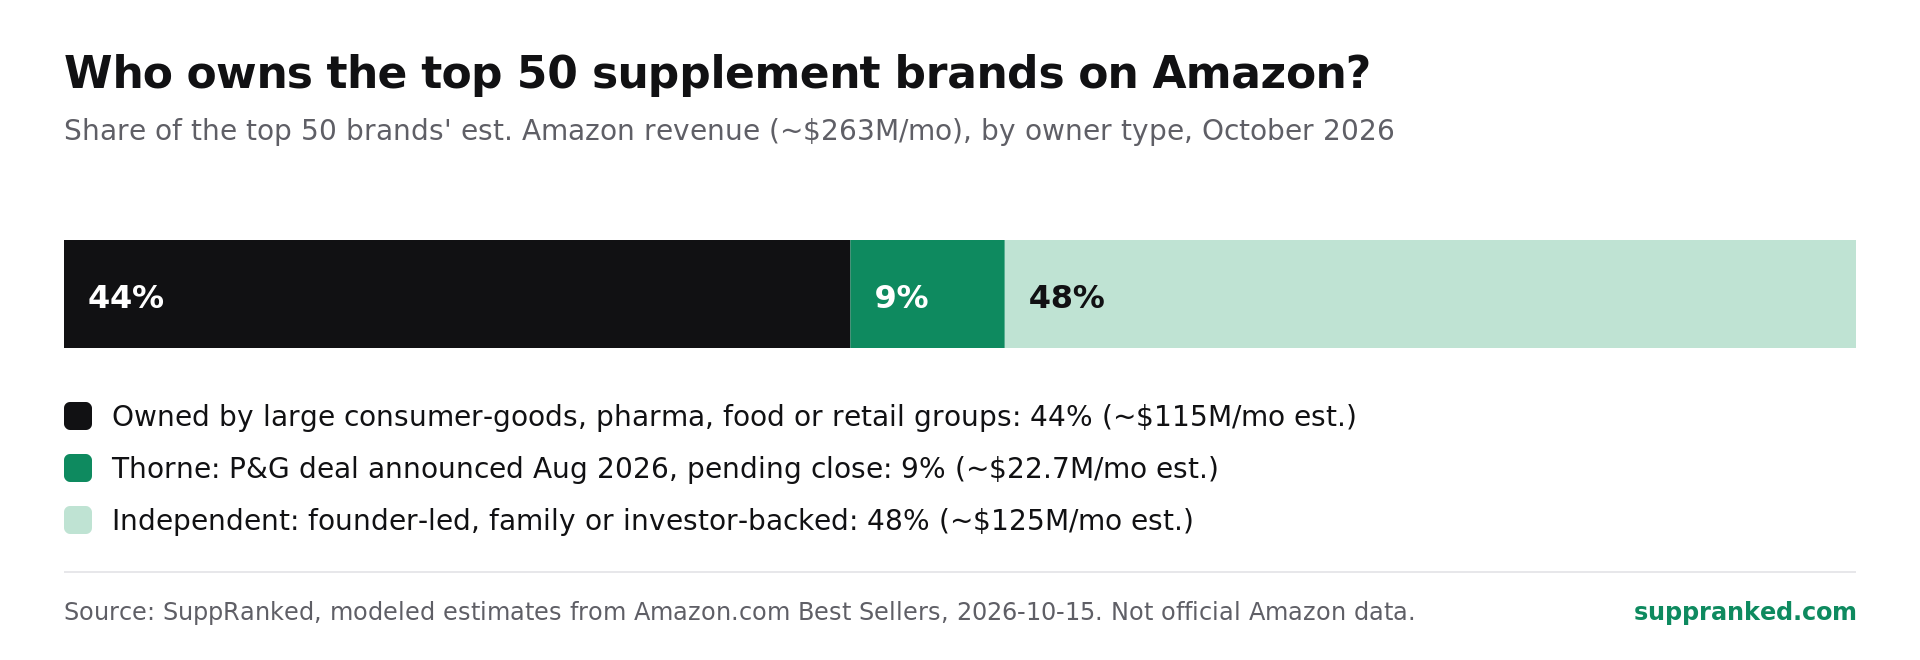
We classified the top 50 brands by est. revenue using publicly reported ownership as of October 15, 2026. Owned by large consumer-goods, pharma, food or retail groups: Nature Made (Pharmavite (Otsuka)), Pure Encapsulations (Nestlé Health Science), Garden of Life (Nestlé Health Science), Nature's Bounty (Nestlé (sale to Yellow Wood Partners announced Sept 2026, pending)), Optimum Nutrition (Glanbia), Metamucil (Procter & Gamble), Olly (Unilever), Orgain (Nestlé Health Science (majority)), Qunol (Opella (formerly Sanofi Consumer Healthcare)), Quest Nutrition (The Simply Good Foods Co.), Liquid I.V. (Unilever), Align (Procter & Gamble), Centrum (Haleon), Gruns (Unilever (closed June 2026)), One A Day (Bayer), SmartyPants (Unilever), MegaFood (Pharmavite (Otsuka)), Culturelle (i-Health (dsm-firmenich)), Amazon Basics (Amazon), Ensure (Abbott), Isopure (Glanbia), Dymatize (BellRing Brands). Thorne is counted as independent until P&G's announced acquisition closes. Everything else in the top 50 is founder-led, family-owned or investor-backed. Spotted a deal we missed? Tell us.
Ownership sources
- P&G to acquire Thorne (NutraIngredients, Aug 4 2026)
- Nestlé to divest mainstream VMS brands (Nestlé, Sept 1 2026)
- Unilever completes Grüns acquisition (Unilever, 2026)
- Sanofi completes Qunol acquisition (Sanofi, Sept 2023)
- Pharmavite acquires FoodState / MegaFood (2014)
Formats and sizes: creatine, magnesium, protein
- Creatine: gummies take 21% of est. creatine revenue. Powder still leads; the typical tub sold is 100 servings at about $0.28 a serving (unit-weighted median of 49 powder listings).
- Magnesium: glycinate appears in 65 of the top 100 listings and 75% of est. revenue. The most common bottle is 90 count.
- Whey protein: isolates take 53% of est. whey revenue; the typical tub is 2 lb (22 servings); clear whey has 9%.
- Gummies overall: 11% of est. revenue across all tracked products.
Formats and sizes are read from product titles, so a listing that does not state its size is left out of that figure.
Methodology
On October 15, 2026 we read the top 100 products in 40 Amazon.com US Best Sellers lists under Health & Household (supplements): 3,202 unique products from 935 brands after cleaning. Each product's monthly units are estimated from its "bought in past month" badge where Amazon shows one, otherwise from a rank-to-sales curve fitted to the badged products. Revenue is est. units × list price (missing prices are filled with the median of the brand's or category's other products). Products appear in several lists, so category totals overlap; brand and market totals count each product once. Brand names are matched from product pages and titles, and a small share of products could not be tied to a brand. Full details: methodology. Machine-readable figures for this report: data.json (CC BY 4.0).
Cite this report
Free to quote and republish with credit and a link. Please describe the numbers as estimates.
Embed a chart
Paste this into any page. Swap top10-brands for category-concentration, fastest-moving-categories or ownership-top50.
Press and custom cuts
Journalists, analysts and newsletter writers can ask for a custom cut of the data (a category, a set of brands, a price band) at [email protected]. The open JSON API has the full daily dataset under CC BY 4.0.